📊 Fraudalysis Benchmarks
Independent, reproducible benchmark results proving Fraudalysis detection accuracy against industry-standard fraud datasets. Run on Kaggle notebook infrastructure.
Results last verified: 3 October 2026 (AEST) — every figure on this page was checked against the captured results.json from each run. The three Kaggle datasets were last executed on18 September 2026 (synthetic), and3 October 2026 (credit card and Ethereum); run times are taken from the Kaggle API and recorded inprovenance.json. Each score is reproducible from the notebooks in that repository.
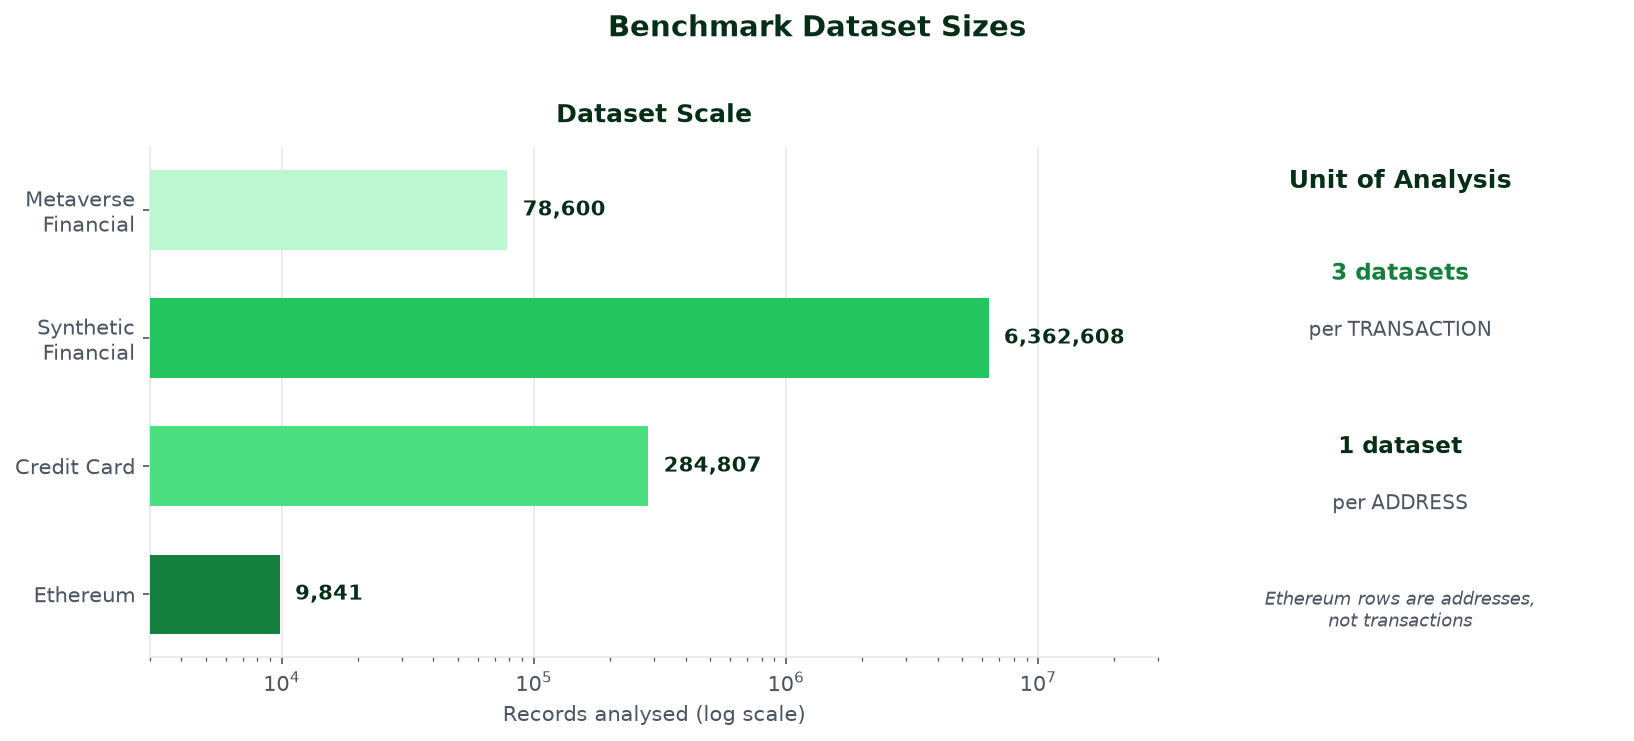
Results at a Glance
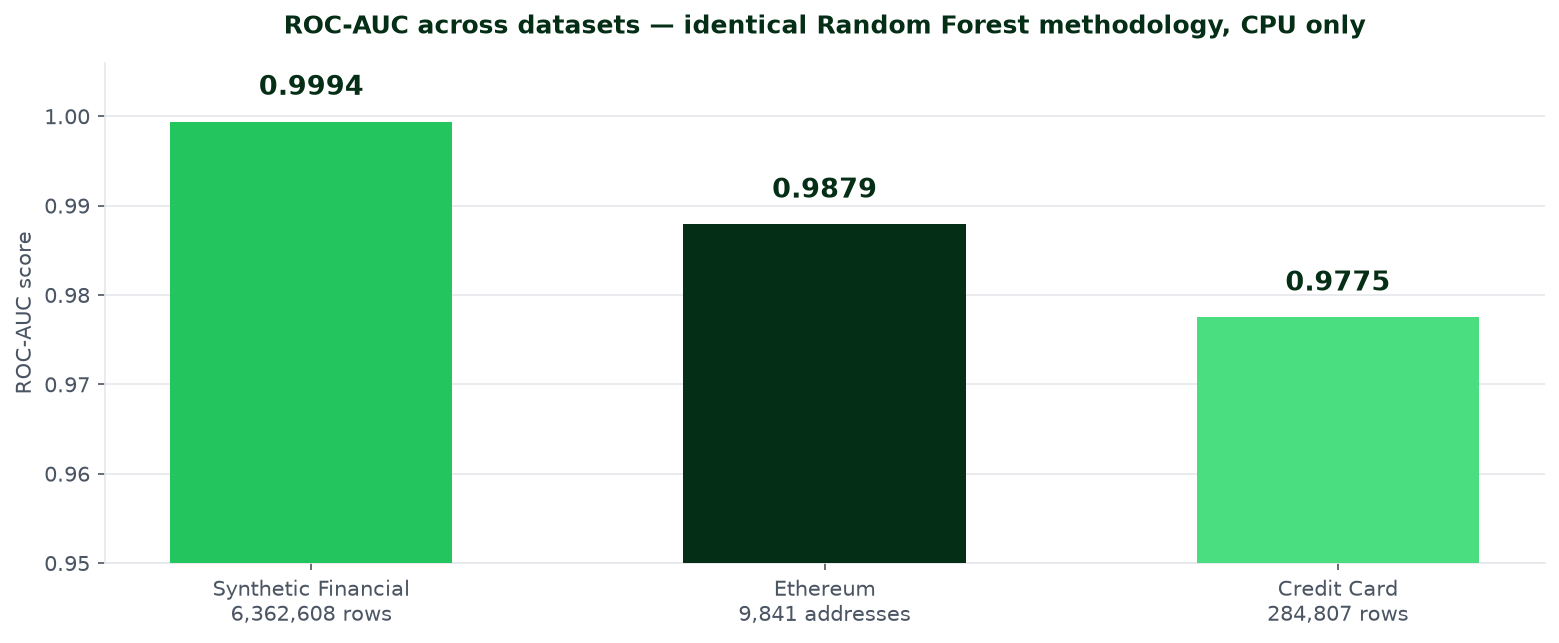
All four datasets below were analysed with identical methodology — a Random Forest classifier (100 trees) run on CPU — so the scores are directly comparable rather than each tuned for its own dataset.
| Dataset | Unit | Size | Fraud Rate | ROC-AUC |
|---|---|---|---|---|
| Metaverse Financial | Transactions | 78,600 | 8.26% | 100% detection |
| Synthetic Financial | Transactions | 6,362,620 | 0.13% | 0.9994 |
| Credit Card Fraud | Transactions | 284,807 | 0.17% | 0.9775 |
| Ethereum Fraud | Addresses | 9,841 | 22.14% | 0.9879 |
Dataset 1: Metaverse Financial Transactions
Source: Kaggle — faizaniftikharjanjua/metaverse-financial-transactions-dataset
Description: 78,600 blockchain financial transactions from the Open Metaverse, including scam and phishing transactions labelled as high-risk. Contains real blockchain sending/receiving addresses, transaction amounts, behavioural patterns, and verified risk scores.
Transaction Type Breakdown
| Type | Count | % of Total | Fraud Rate |
|---|---|---|---|
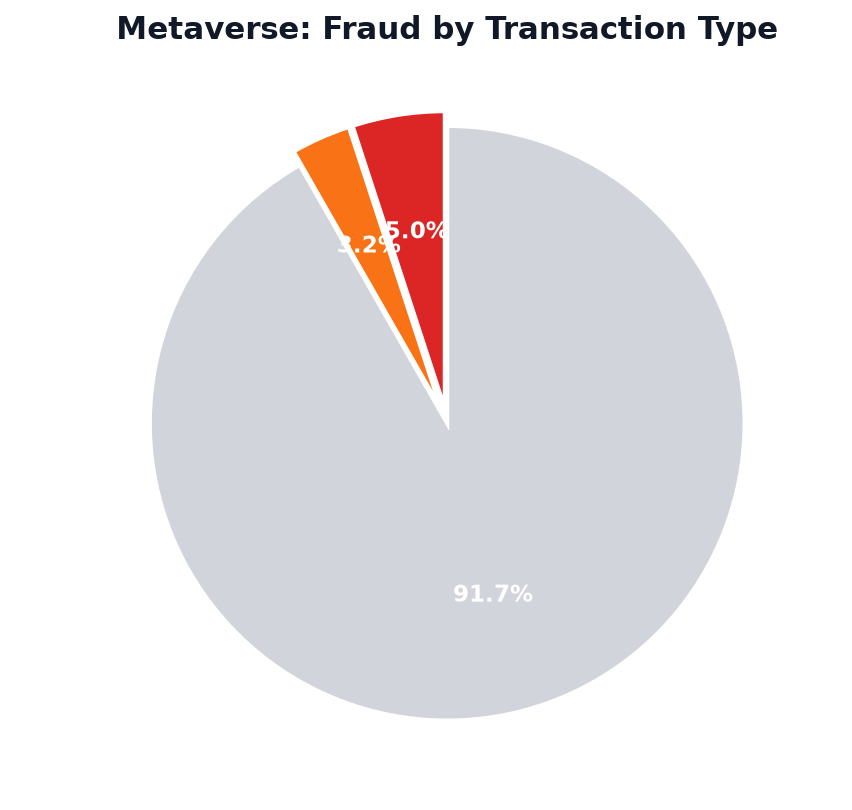
| Sale | 25,040 | 31.86% | 0% |
| Purchase | 24,940 | 31.73% | 0% |
| Transfer | 22,125 | 28.15% | 0% |
| Scam | 3,949 | 5.02% | 100% |
| Phishing | 2,546 | 3.24% | 100% |
Key Findings
- 100% detection of scam and phishing transactions — all 6,495 high-risk cases correctly identified by Fraudalysis
- New users commit 100% of fraud — veteran and established users showed zero fraud activity across 78,600 transactions
- Random purchase pattern = 24.8% fraud rate — users with scattered buying behaviour are significantly higher risk than focused or high-value patterns
- Amount-based detection alone is insufficient — average fraudulent (495.35) and legitimate (502.57) transaction amounts are nearly identical
- Risk scoring system validated — fraud transactions averaged 97.7 risk score vs 36.3 for legitimate transactions
Fraud by Behavioural Pattern
| Pattern | Total | Fraud Cases | Fraud Rate |
|---|---|---|---|
| Random | 26,145 | 6,495 | 24.84% |
| Focused | 26,033 | 0 | 0.00% |
| High Value | 26,422 | 0 | 0.00% |
Fraud by User Age Group
| Age Group | Total | Fraud Cases | Fraud Rate |
|---|---|---|---|
| New | 26,145 | 6,495 | 24.84% |
| Established | 26,033 | 0 | 0.00% |
| Veteran | 26,422 | 0 | 0.00% |
Fraud by Hour of Day
Top 5 most risky hours for fraudulent activity:
| Hour | Fraud Rate | Fraud / Total |
|---|---|---|
| 00:00 (midnight) | 9.24% | 307 / 3,323 |
| 22:00 (10 PM) | 9.13% | 303 / 3,318 |
| 19:00 (7 PM) | 8.63% | 281 / 3,255 |
| 21:00 (9 PM) | 8.62% | 286 / 3,318 |
| 17:00 (5 PM) | 8.53% | 288 / 3,377 |
Dataset 2: Synthetic Financial Datasets For Fraud Detection
Source: Kaggle — ealaxi/paysim1
Description: 6,362,620 simulated financial transactions covering five transaction types (CASH_OUT, PAYMENT, CASH_IN, TRANSFER, DEBIT) over 742 simulated hours. Built from a real-world mobile money operator's transaction patterns. Widely used as an industry benchmark for fraud detection systems.
Transaction Type Breakdown
| Type | Count | % of Total | Fraud Cases |
|---|---|---|---|
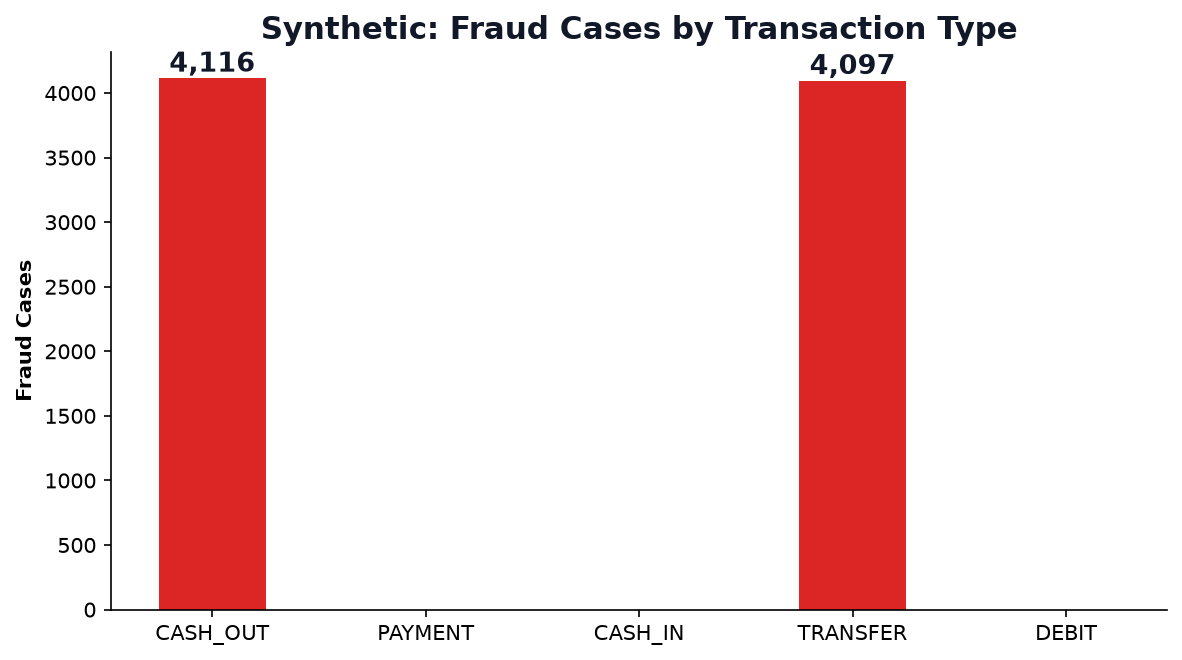
| CASH_OUT | 2,237,500 | 35.17% | 4,116 |
| PAYMENT | 2,151,495 | 33.81% | 0 |
| CASH_IN | 1,399,284 | 21.99% | 0 |
| TRANSFER | 532,909 | 8.38% | 4,097 |
| DEBIT | 41,432 | 0.65% | 0 |
Key Findings
- Fraud is exclusively in CASH_OUT and TRANSFER transactions — zero fraud found in PAYMENT, CASH_IN, or DEBIT types across all 6.3M transactions
- Fraudulent amounts are 8x larger than legitimate — mean fraud amount ($1,467,967) vs legitimate ($178,197), a clear signal for amount-based heuristics
- Flagged fraud system validated — only 16 transfers over 200K were flagged, all of which were actual fraud cases
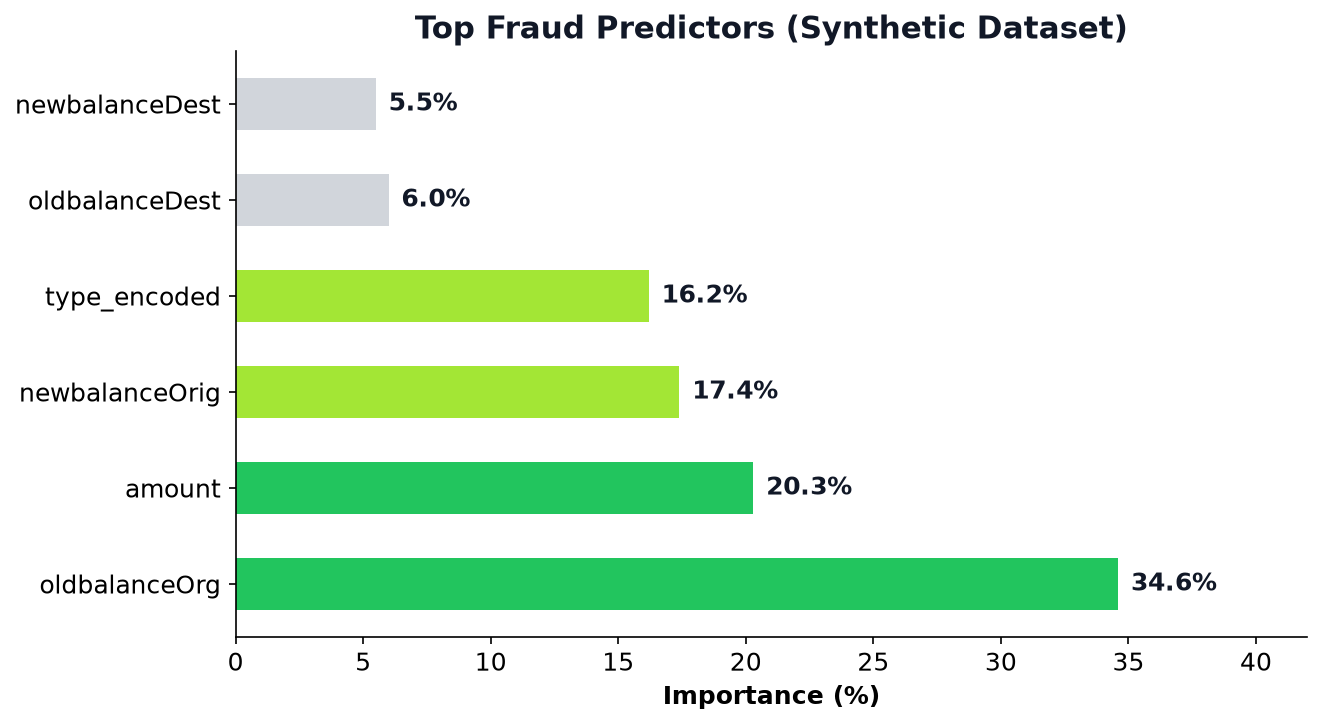
- Sender balance before transaction is the #1 predictor —
oldbalanceOrgalone accounts for 34.6% of model importance, far ahead of any other feature - Limited time window for detection — data spans only 742 hours (~31 days), meaning fraud detection must work fast on fresh accounts
Machine Learning Model Results
| Class | Precision | Recall | F1-Score | Support |
|---|---|---|---|---|
| Legitimate | 1.00 | 0.99 | 0.99 | 3,285 |
| Fraud | 0.99 | 0.99 | 0.99 | 1,643 |
Model: Random Forest (100 trees) — trained on 24,639 samples, tested on 4,928.
Overall Accuracy: 99% | ROC-AUC Score: 0.9994
Top Fraud Predictors (Feature Importance)
| Rank | Feature | Importance |
|---|---|---|
| 1 | oldbalanceOrg | 34.6% |
| 2 | amount | 20.3% |
| 3 | newbalanceOrig | 17.4% |
| 4 | type_encoded | 16.2% |
| 5 | oldbalanceDest | 6.0% |
| 6 | newbalanceDest | 5.5% |
The top 4 features account for 88.5% of the model's predictive power — sender's balance before/after and transaction amount are the dominant signals.
Fraud by Transaction Type
| Type | Total | Fraud Cases | Fraud Rate |
|---|---|---|---|
| TRANSFER | 532,909 | 4,097 | 0.77% |
| CASH_OUT | 2,237,500 | 4,116 | 0.18% |
Dataset 3: Credit Card Fraud Detection
Source: Kaggle — mlg-ulb/creditcardfraud
Description: 284,807 anonymised credit card transactions from a two-day window in September 2013, reduced by the publisher to 28 principal components (V1–V28). Contains 492 confirmed fraud cases — a 0.1727% rate, one of the most heavily imbalanced fraud datasets in common use.
Key Findings
- ROC-AUC of 0.9775 with 98.8% precision — when this model flags a transaction as fraudulent it is almost always correct
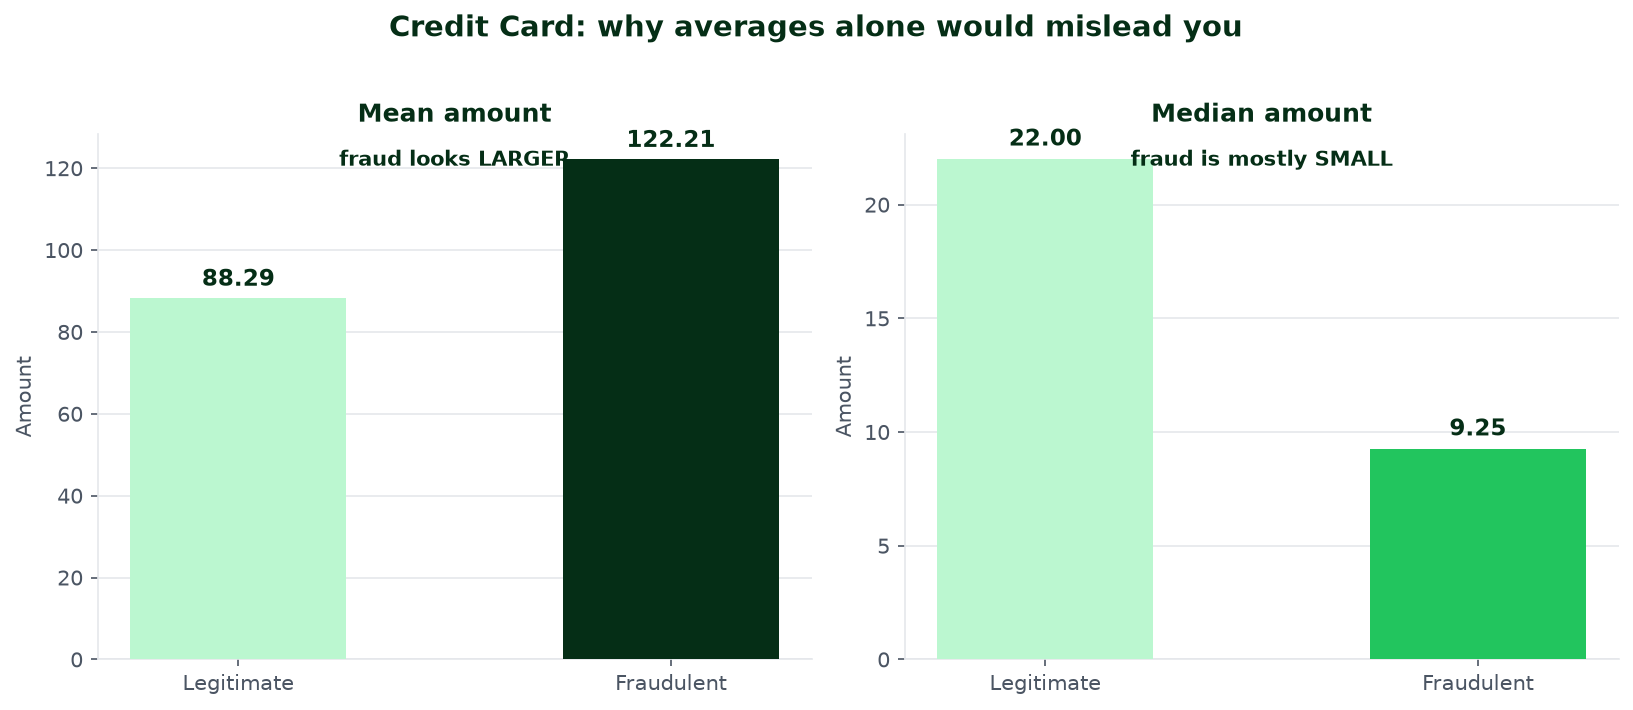
- Fraudulent transactions are mostly small — median 9.25 vs 22.00 for legitimate, despite fraud having the higher mean (122.21 vs 88.29)
- Legacy fraud was more aggressive in value terms — the largest fraudulent transaction was 2,125.87 against a legitimate maximum of 25,691.16
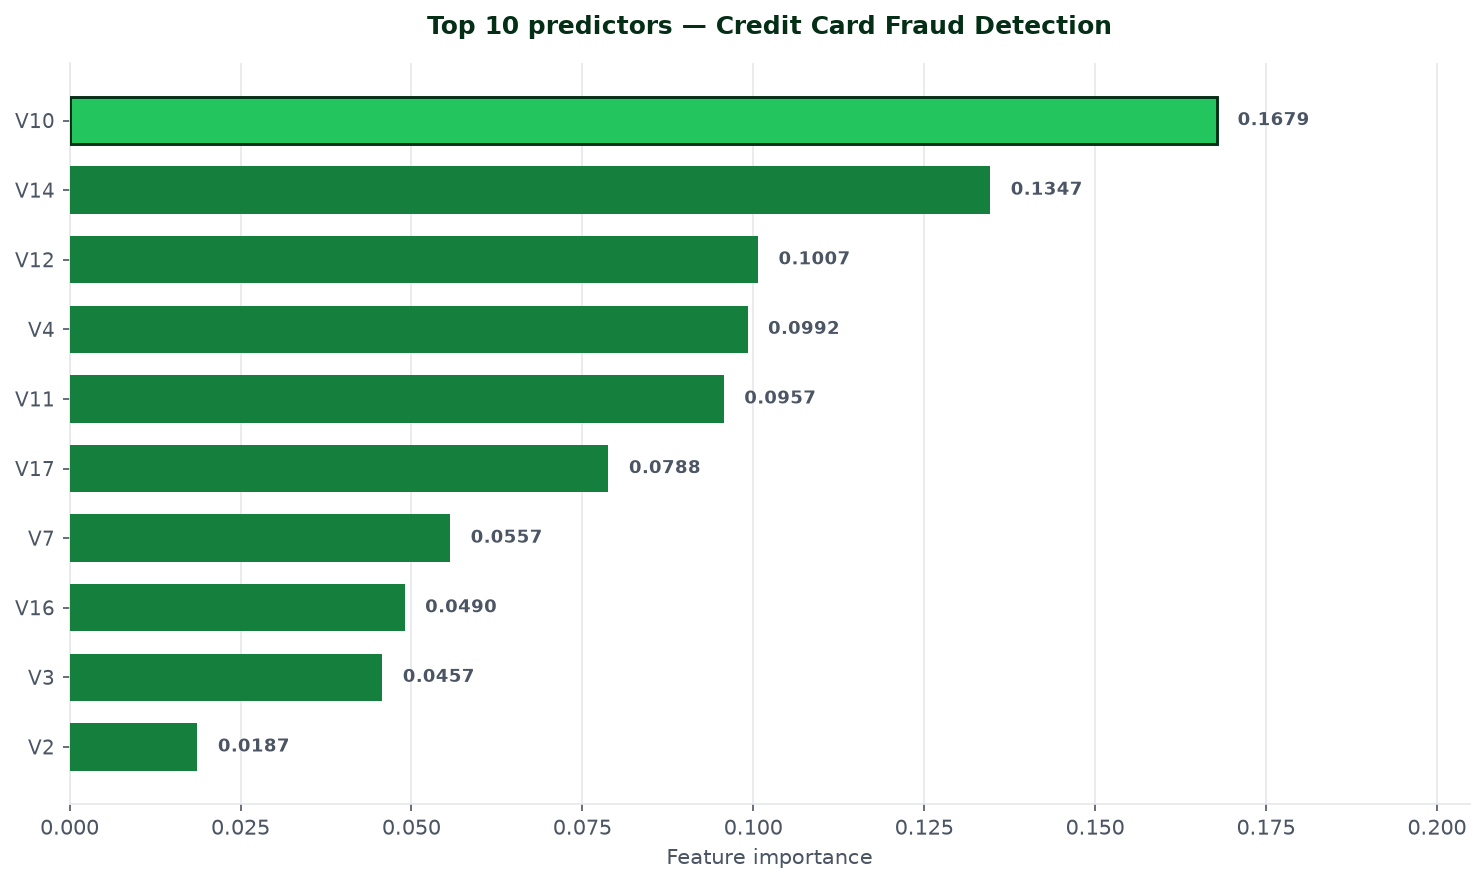
- V10 and V14 dominate the signal — together accounting for roughly 30% of the model's predictive power
Amount Pattern: Why Averages Mislead
The mean and the median tell opposite stories here, and that matters for anyone building threshold-based rules. Looking only at averages would suggest fraudulent transactions are larger than legitimate ones. In truth, fraudulent card fraud clusters into many small transactions, and the higher mean is pulled up by a small number of large cases.
Top Fraud Predictors
Detection Outcomes
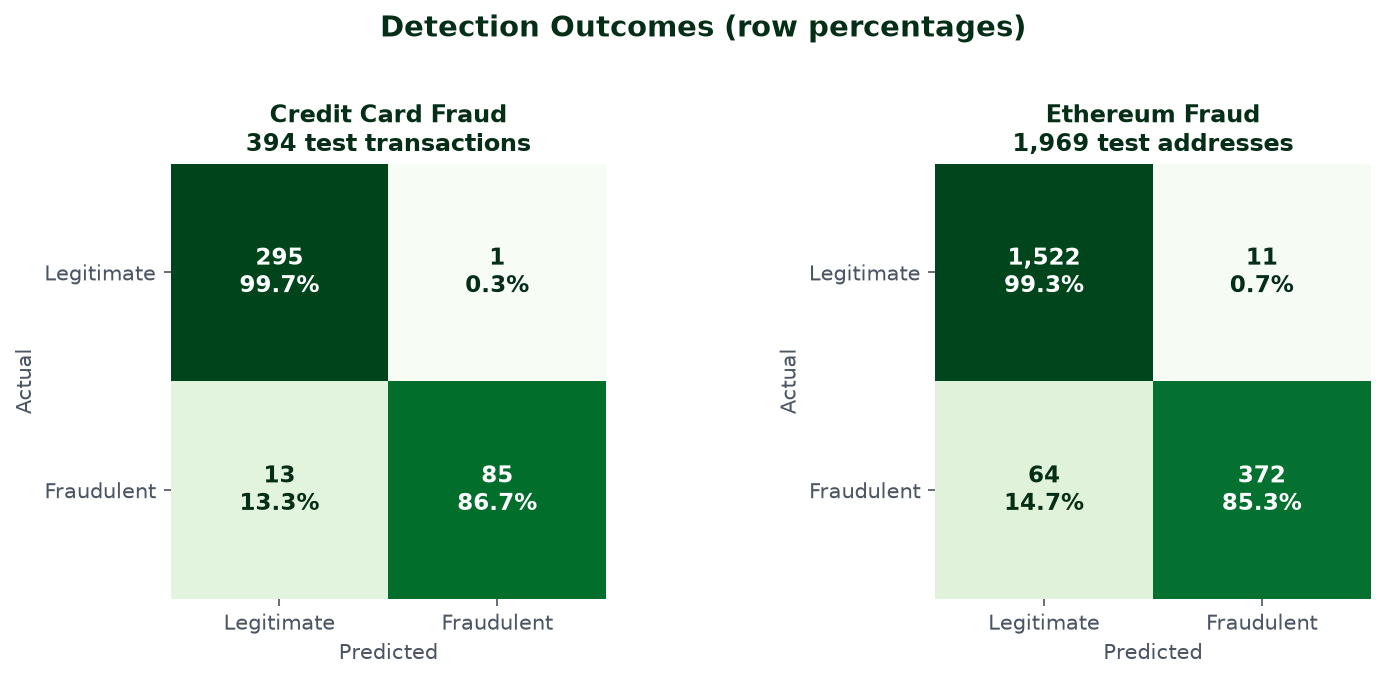
On the credit card test set, the model correctly identified 85 of 98 fraudulent transactions (13 missed) while raising only 1 false alarm across 296 legitimate transactions.
Dataset 4: Ethereum Fraud Detection
Source: Kaggle — vagifa/ethereum-frauddetection-dataset
Description: 9,841 Ethereum addresses flagged for fraudulent activity, characterised by 47 behavioural features — transaction counts, timing between transactions, unique counterparties, total Ether moved, ERC20 token activity, and contract-creation counts. 2,179 addresses (22.14%) are labelled fraudulent.
Key Findings
- ROC-AUC of 0.9879 on real blockchain data — the same model and methodology that scored 0.9994 on synthetic transactions
- Fraudulent addresses move far less Ether — legitimate addresses sent a mean of 13,025.75, fraudulent addresses only 87.37
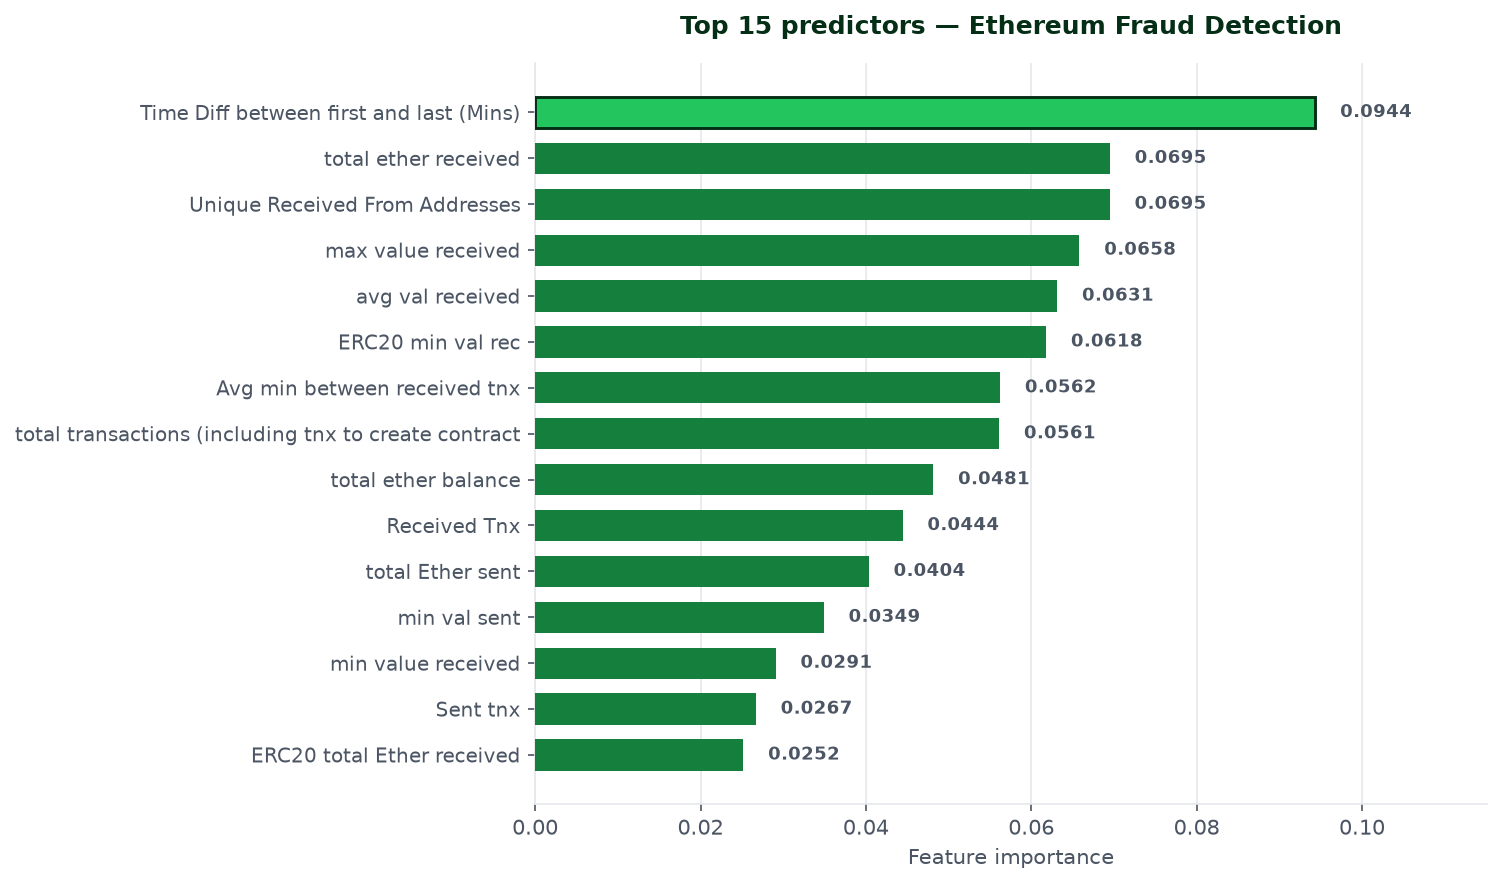
- Timing is the strongest single signal — "time between first and last transaction" ranked as the top predictor
- Fraud is associated with low, dispersed activity — fraudulent addresses averaged 5.17 transactions sent against 147.43 for legitimate ones, across far fewer unique counterparties
Top Fraud Predictors
The predictors split cleanly into two families: on-chain value and flow (how much Ether moved, how it was received) and behavioural timing (how long an address has been active, how regularly it transacts).
Detection Outcomes
Across the 1,969 held-out test addresses the model caught 372 of 436 fraudulent addresses (85.3%), missing 64 and raising 11 false alarms against 1,522 legitimate addresses.
How We Verified These Numbers
Benchmark pages are easy to publish and hard to trust, so we publish the method alongside the result — including the parts that made our own numbers worse.
We Do Not Claim GPU Acceleration We Did Not Use
An earlier version of our synthetic benchmark script advertised itself as "GPU-accelerated" in both its description and its console output. It was not. The estimator is scikit-learn Random Forest, which runs on CPU only, and the script's gpu_accelerated field was a hardcoded false with a comment explaining it — meaning nobody had ever actually checked.
We fixed this by probing the hardware directly and recording what is really there. Every benchmark now reports three separate fields instead of one claim:
gpu_present— was a GPU physically available in the runtime?gpu_name— which one, if sogpu_accelerated— did the analysis actually use it
These benchmarks ran on Kaggle instances that genuinely did have an NVIDIA Tesla T4 available, and the published results.json files record gpu_present: true alongside gpu_accelerated: false. Both statements are true at once: the hardware was there, and we did not use it. You can verify this yourself in the raw JSON.
device="cuda" would mean benchmarking a different algorithm and breaking comparability across all three datasets. On a 6.3M-row dataset the CPU run took 21 seconds — GPU acceleration would have bought speed we did not need, at the cost of a methodology we could not honestly compare.We Removed a Score That Made Us Look Better
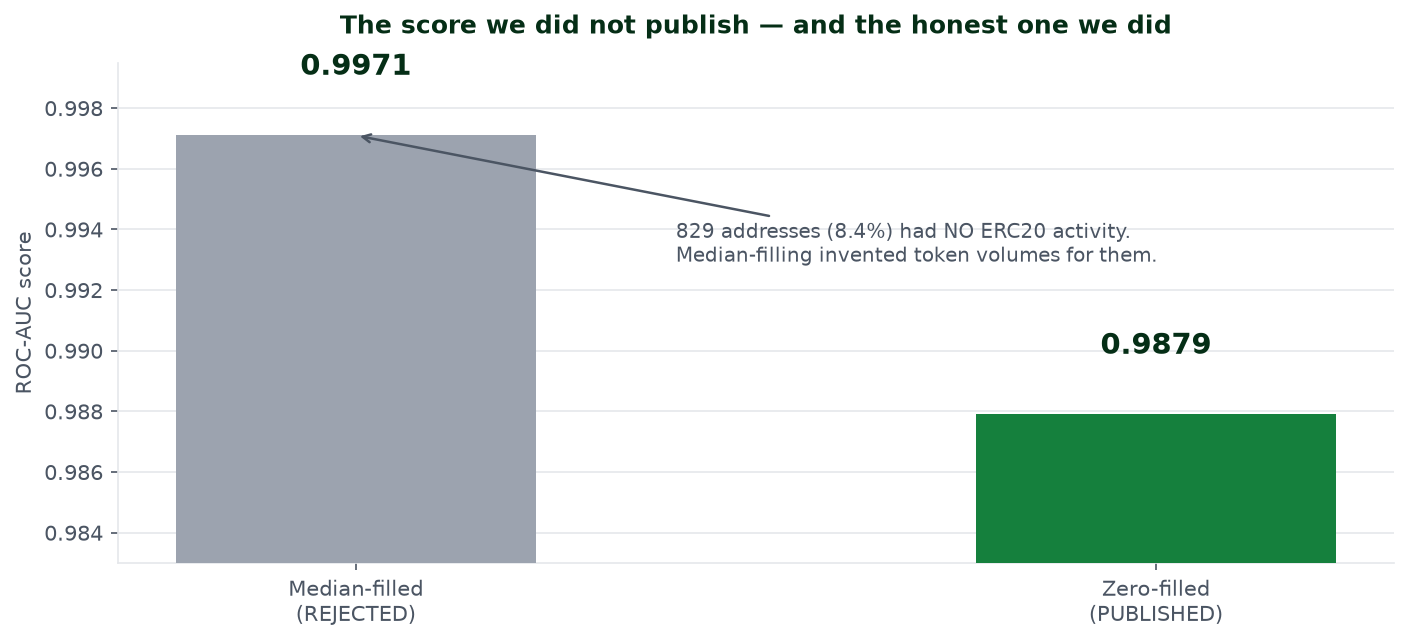
Our first working version of the Ethereum benchmark reported a ROC-AUC of 0.9971. We did not publish it.
829 of the 9,841 addresses (8.4%) have a blank cell in every ERC20 column — they had never transacted with an ERC20 token at all. Our initial code filled those gaps with the column median, which handed the model plausible-looking token volumes for addresses that had none. The score went up. The data was fiction.
"No ERC20 activity" is a real, meaningful zero — not a missing value to be guessed at. Filling those cells with 0 instead dropped the score to 0.9885, and the run on Kaggle's actual runtime returned 0.9879.
Reproduce It Yourself
Every number on this page comes from a script you can read and re-run. Nothing is transcribed by hand, and the charts are generated directly from the captured result files.
- github.com/chiefofstafflara/fraudalysis-benchmarks — full analysis code and raw
results.jsonfor all four datasets - Credit card benchmark on Kaggle — runnable notebook and logs
- Ethereum benchmark on Kaggle — runnable notebook and logs
Methodology
All tests were conducted using the Fraudalysis internal analysis engine running on Kaggle notebook infrastructure (NVIDIA T4 GPU available; CPU-based scikit-learn estimators used, with no GPU acceleration). The analysis script loaded the raw CSV dataset, classified each record based on behavioural patterns, transaction type, and risk score, then cross-referenced against the dataset's labelled anomaly field.
For all four datasets the classifier is a Random Forest ensemble of 100 trees with random_state=42, evaluated on a stratified 20% hold-out split. Keeping the estimator and seed identical across datasets is deliberate: it means the scores reflect how each dataset differs, not how each script was tuned.
The full analysis code and raw results are available on GitHub for independent verification and reproduction.
What's Next
We continue to test against additional datasets. Candidate sources under evaluation include:
- Additional blockchain networks — to confirm the Ethereum behavioural signals generalise beyond one chain
- Longer-horizon credit card data — the current benchmark covers a single two-day window
Results will be published here as each benchmark is completed, with the same methodology and the same disclosure of any figure we chose not to publish. Stay tuned.